
Page 1095 - Proceedings Collega2023
P. 1095
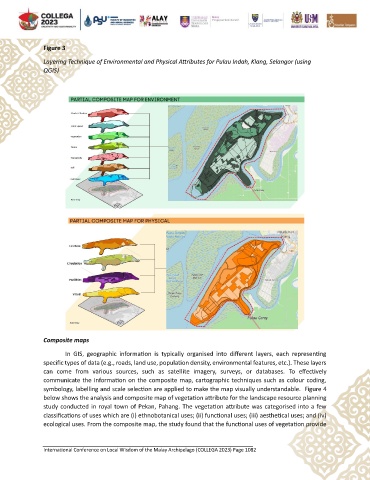
Figure 3

               Layering Technique of Environmental and Physical Attributes for Pulau Indah, Klang, Selangor (using
               QGIS)


               Composite maps
                       In  GIS,  geographic  information  is  typically  organised  into  different  layers,  each  representing
               specific types of data (e.g., roads, land use, population density, environmental features, etc.). These layers
               can  come  from  various  sources,  such  as  satellite  imagery,  surveys,  or  databases.  To  effectively
               communicate the information on the composite map, cartographic techniques such as  colour coding,
               symbology, labelling and scale selection are applied to make the map visually understandable.  Figure 4
               below shows the analysis and composite map of vegetation attribute for the landscape resource planning
               study conducted in royal town of Pekan, Pahang. The vegetation attribute was categorised into a few
               classifications of uses which are (i) ethnobotanical uses; (ii) functional uses; (iii) aesthetical uses; and (iv)
               ecological uses. From the composite map, the study found that the functional uses of vegetation provide


               International Conference on Local Wisdom of the Malay Archipelago (COLLEGA 2023) Page 1082