
Page 651 - Proceedings Collega2023
P. 651
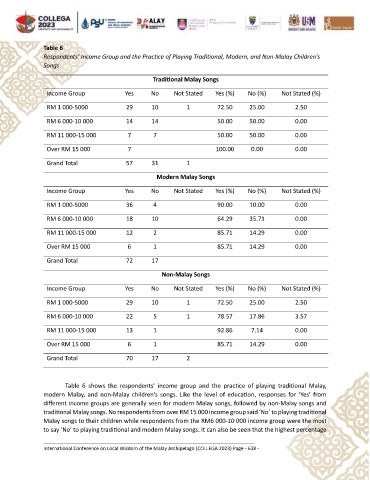
Table 6
               Respondents’ Income Group and the Practice of Playing Traditional, Modern, and Non-Malay Children’s
               Songs

                                                    Traditional Malay Songs
                Income Group              Yes      No      Not Stated   Yes (%)    No (%)     Not Stated (%)


                RM 1 000-5000              29      10          1         72.50      25.00          2.50
                RM 6 000-10 000            14      14                    50.00      50.00          0.00

                RM 11 000-15 000           7        7                    50.00      50.00          0.00

                Over RM 15 000             7                            100.00      0.00           0.00

                Grand Total                57      31          1

                                                     Modern Malay Songs

                Income Group              Yes      No      Not Stated   Yes (%)    No (%)     Not Stated (%)

                RM 1 000-5000              36       4                    90.00      10.00          0.00
                RM 6 000-10 000            18      10                    64.29      35.71          0.00

                RM 11 000-15 000           12       2                    85.71      14.29          0.00

                Over RM 15 000             6        1                    85.71      14.29          0.00

                Grand Total                72      17

                                                       Non-Malay Songs

                Income Group              Yes      No      Not Stated   Yes (%)    No (%)     Not Stated (%)

                RM 1 000-5000              29      10          1         72.50      25.00          2.50

                RM 6 000-10 000            22       5          1         78.57      17.86          3.57

                RM 11 000-15 000           13       1                    92.86      7.14           0.00
                Over RM 15 000             6        1                    85.71      14.29          0.00

                Grand Total                70      17          2


                       Table  6  shows  the  respondents'  income  group  and  the  practice  of  playing  traditional  Malay,
               modern  Malay,  and  non-Malay  children’s  songs.  Like  the  level of  education,  responses  for  ‘Yes’  from
               different income groups are generally seen for modern Malay songs, followed by non-Malay songs and
               traditional Malay songs. No respondents from over RM 15 000 income group said ‘No’ to playing traditional
               Malay songs to their children while respondents from the RM6 000-10 000 income group were the most
               to say ‘No’ to playing traditional and modern Malay songs. It can also be seen that the highest percentage


               International Conference on Local Wisdom of the Malay Archipelago (COLLEGA 2023) Page - 638 -