
Page 647 - Proceedings Collega2023
P. 647
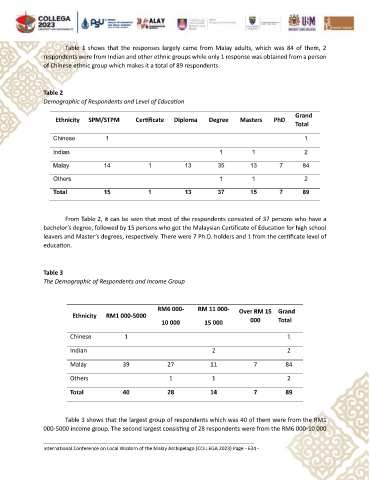
Table  1  shows  that  the  responses  largely  came  from  Malay  adults,  which  was  84  of  them,  2
               respondents were from Indian and other ethnic groups while only 1 response was obtained from a person
               of Chinese ethnic group which makes it a total of 89 respondents.


               Table 2
               Demographic of Respondents and Level of Education

                                                                                                   Grand
                   Ethnicity   SPM/STPM       Certificate   Diploma   Degree    Masters     PhD
                                                                                                   Total

                   Chinese          1                                                                 1

                   Indian                                                 1         1                 2

                   Malay           14             1           13         35         13        7      84
                   Others                                                 1         1                 2

                   Total           15             1           13         37         15        7      89


                       From Table 2, it can be seen that most of the respondents consisted of 37 persons who have a
               bachelor’s degree, followed by 15 persons who got the Malaysian Certificate of Education for high school
               leavers and Master’s degrees, respectively. There were 7 Ph.D. holders and 1 from the certificate level of
               education.


               Table 3
               The Demographic of Respondents and Income Group


                                                     RM6 000-      RM 11 000-   Over RM 15  Grand
                         Ethnicity   RM1 000-5000
                                                      10 000         15 000         000      Total

                        Chinese           1                                                     1

                        Indian                                         2                        2
                        Malay             39            27             11            7          84

                        Others                           1             1                        2

                        Total             40            28             14            7          89


                       Table 3 shows that the largest group of respondents which was 40 of them were from the RM1
               000-5000 income group. The second largest consisting of 28 respondents were from the RM6 000-10 000


               International Conference on Local Wisdom of the Malay Archipelago (COLLEGA 2023) Page - 634 -