Page 82 - 068
P. 82

68


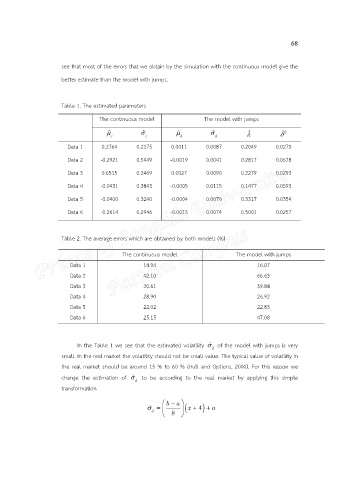
                       see that most of the errors that we obtain by the simulation with the continuous model give the
                       better estimate than the model with jumps.


                       Table 1. The estimated parameters

                                    The continuous model                 The model with jumps

                                       ˆ          ˆ          ˆ          ˆ                     
                                                                                        ˆ
                                                                                                    ˆ
                                                                                                     2
                                        c           c           d           d
                         Data 1      0.2764      0.2275      0.0011      0.0087       0.2049      0.0273
                         Data 2     -0.2921      0.5449      -0.0019     0.0041       0.2817      0.0678

                         Data 3      0.6515      0.2469      0.0027      0.0090       0.2279      0.0293

                         Data 4     -0.0431      0.3843      -0.0005     0.0115       0.1477      0.0593
                         Data 5     -0.0400      0.3240      -0.0004     0.0076       0.3317      0.0354

                         Data 6     -0.2614      0.2946      -0.0013     0.0074       0.5001      0.0257


                       Table 2. The average errors which are obtained by both models (%)


                                            The continuous model                    The model with jumps
                          Data 1                   14.94                                   16.07
                          Data 2                   42.10                                   66.63

                          Data 3                   20.61                                   39.84
                          Data 4                   28.90                                   26.92
                          Data 5                   22.02                                   22.83
                          Data 6                   25.15                                   47.08


                            In the Table 1 we see that the estimated volatility  ˆ   of the model with jumps is very
                                                                           d
                       small. In the real market the volatility should not be small value. The typical value of volatility in
                       the real market should be around 15 % to 60 % (Hull and Options, 2000). For this reason we

                       change  the  estimation  of  ˆ    to  be  according  to  the  real  market  by  applying  this  simple
                                                d
                       transformation

                                                           b   a  
                                                                     ˆ         x    4 
                                                                           a
                                                      d
                                                            8   
   77   78   79   80   81   82   83   84   85   86