
Page 74 - 048
P. 74
56
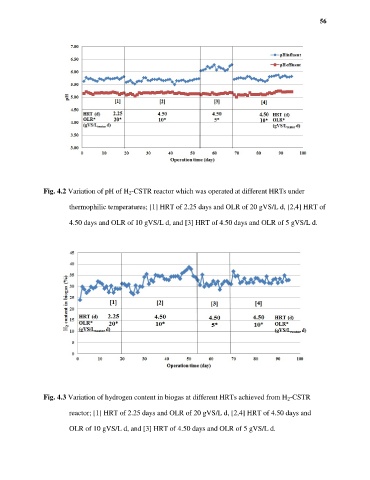
Fig. 4.2 Variation of pH of H 2-CSTR reactor which was operated at different HRTs under
thermophilic temperatures; [1] HRT of 2.25 days and OLR of 20 gVS/L d, [2,4] HRT of
4.50 days and OLR of 10 gVS/L d, and [3] HRT of 4.50 days and OLR of 5 gVS/L d.
Fig. 4.3 Variation of hydrogen content in biogas at different HRTs achieved from H 2-CSTR
reactor; [1] HRT of 2.25 days and OLR of 20 gVS/L d, [2,4] HRT of 4.50 days and
OLR of 10 gVS/L d, and [3] HRT of 4.50 days and OLR of 5 gVS/L d.