
Page 854 - Proceedings Collega2023
P. 854
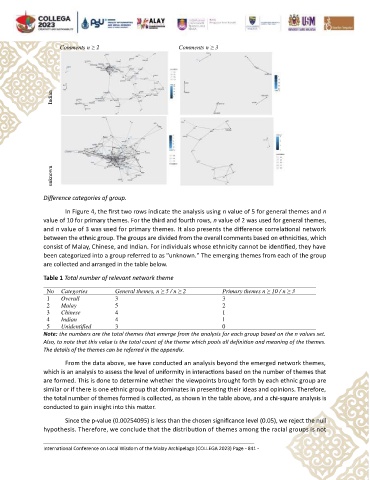
Comments n ≥ 2                         Comments n ≥ 3


                  Indian


                  unknown


               Difference categories of group.

                       In Figure 4, the first two rows indicate the analysis using n value of 5 for general themes and n
               value of 10 for primary themes. For the third and fourth rows, n value of 2 was used for general themes,
               and n value of 3 was used for primary themes. It also presents the difference correlational network
               between the ethnic group. The groups are divided from the overall comments based on ethnicities, which
               consist of Malay, Chinese, and Indian. For individuals whose ethnicity cannot be identified, they have
               been categorized into a group referred to as "unknown." The emerging themes from each of the group
               are collected and arranged in the table below.

               Table 1 Total number of relevant network theme
                No  Categories         General themes, n ≥ 5 / n ≥ 2       Primary themes n ≥ 10 / n ≥ 3
                1    Overall           3                                   3
                2    Malay             5                                   2
                3    Chinese           4                                   1
                4    Indian            4                                   1
                5    Unidentified      3                                   0
               Note: the numbers are the total themes that emerge from the analysis for each group based on the n values set.
               Also, to note that this value is the total count of the theme which pools all definition and meaning of the themes.
               The details of the themes can be referred in the appendix.
                       From the data above, we have conducted an analysis beyond the emerged network themes,
               which is an analysis to assess the level of uniformity in interactions based on the number of themes that
               are formed. This is done to determine whether the viewpoints brought forth by each ethnic group are
               similar or if there is one ethnic group that dominates in presenting their ideas and opinions. Therefore,
               the total number of themes formed is collected, as shown in the table above, and a chi-square analysis is
               conducted to gain insight into this matter.

                       Since the p-value (0.00254095) is less than the chosen significance level (0.05), we reject the null
               hypothesis. Therefore, we conclude that the distribution of themes among the racial groups is not


               International Conference on Local Wisdom of the Malay Archipelago (COLLEGA 2023) Page - 841 -