
Page 73 - 068
P. 73
59
In this study we aim to fit the Thailand rubber price with the continuous pricing model and
the model with jump where the parameters are estimated from the historical data and also to
compare the results which are obtained by both models.
2 Presentation of the data
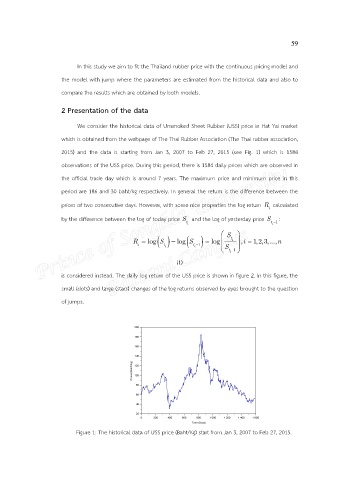
We consider the historical data of Unsmoked Sheet Rubber (USS) price in Hat Yai market
which is obtained from the webpage of The Thai Rubber Association (The Thai rubber association,
2015) and the data is starting from Jan 3, 2007 to Feb 27, 2015 (see Fig. 1) which is 1584
observations of the USS price. During this period, there is 1584 daily prices which are observed in
the official trade day which is around 7 years. The maximum price and minimum price in this
period are 186 and 30 baht/kg respectively. In general the return is the difference between the
prices of two consecutive days. However, with some nice properties the log return R calculated
i
by the difference between the log of today price S and the log of yesterday price S :
i t t 1
i
R log S log S log S t i ,i 1,2,3,...,n
i t t 1
i i S
t 1
i
(1)
is considered instead. The daily log return of the USS price is shown in figure 2. In this figure, the
small (dots) and large (stars) changes of the log returns observed by eyes brought to the question
of jumps.
Figure 1: The historical data of USS price (Baht/Kg) start from Jan 3, 2007 to Feb 27, 2015.