
Page 96 - 048
P. 96
☺
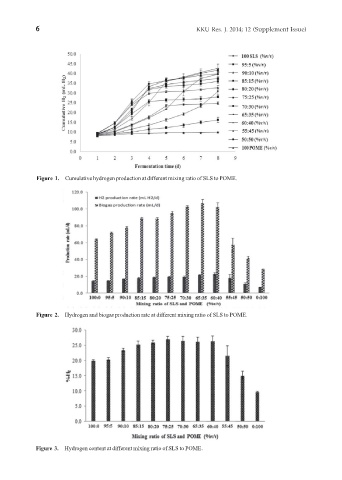
Figure 1. Cumulative hydrogen production at different mixing ratio of SLS to POME.
Figure 2. Hydrogen and biogas production rate at different mixing ratio of SLS to POME.
Figure 3. Hydrogen content at different mixing ratio of SLS to POME.