Page 54 - 048
P. 54

36


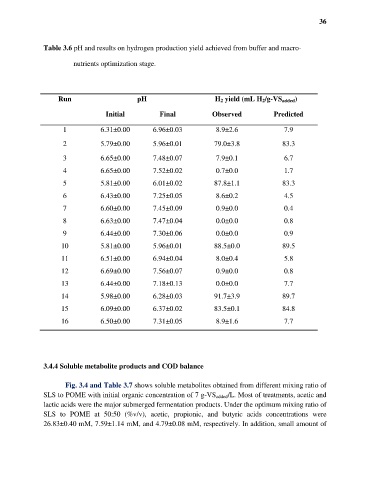
               Table 3.6 pH and results on hydrogen production yield achieved from buffer and macro-

                         nutrients optimization stage.


                    Run                       pH                        H 2 yield (mL H 2/g-VS added)

                                    Initial           Final            Observed             Predicted

                      1           6.31±0.00         6.96±0.03           8.9±2.6                7.9

                      2           5.79±0.00         5.96±0.01           79.0±3.8              83.3

                      3           6.65±0.00         7.48±0.07           7.9±0.1                6.7
                      4           6.65±0.00         7.52±0.02           0.7±0.0                1.7

                      5           5.81±0.00         6.01±0.02           87.8±1.1              83.3

                      6           6.43±0.00         7.25±0.05           8.6±0.2                4.5
                      7           6.60±0.00         7.45±0.09           0.9±0.0                0.4

                      8           6.63±0.00         7.47±0.04           0.0±0.0                0.8
                      9           6.44±0.00         7.30±0.06           0.0±0.0                0.9

                     10           5.81±0.00         5.96±0.01           88.5±0.0              89.5
                     11           6.51±0.00         6.94±0.04           8.0±0.4                5.8

                     12           6.69±0.00         7.56±0.07           0.9±0.0                0.8

                     13           6.44±0.00         7.18±0.13           0.0±0.0                7.7
                     14           5.98±0.00         6.28±0.03           91.7±3.9              89.7

                     15           6.09±0.00         6.37±0.02           83.5±0.1              84.8
                     16           6.50±0.00         7.31±0.05           8.9±1.6                7.7


               3.4.4 Soluble metabolite products and COD balance

                       Fig. 3.4 and Table 3.7 shows soluble metabolites obtained from different mixing ratio of
               SLS to POME with initial organic concentration of 7 g-VS added/L. Most of treatments, acetic and
               lactic acids were the major submerged fermentation products. Under the optimum mixing ratio of
               SLS  to  POME  at  50:50  (%v/v),  acetic,  propionic,  and  butyric  acids  concentrations  were
               26.83±0.40 mM, 7.59±1.14 mM, and 4.79±0.08 mM, respectively. In addition, small amount of
   49   50   51   52   53   54   55   56   57   58   59