
Page 53 - 048
P. 53
35
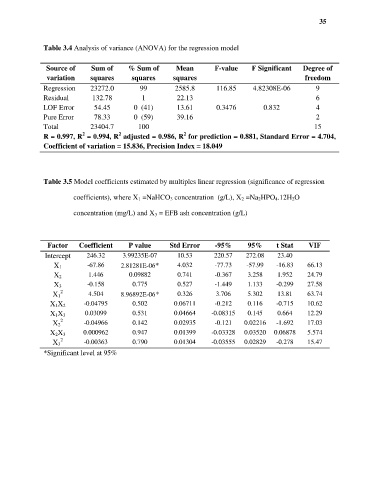
Table 3.4 Analysis of variance (ANOVA) for the regression model
Source of Sum of % Sum of Mean F-value F Significant Degree of
variation squares squares squares freedom
Regression 23272.0 99 2585.8 116.85 4.82308E-06 9
Residual 132.78 1 22.13 6
LOF Error 54.45 0 (41) 13.61 0.3476 0.832 4
Pure Error 78.33 0 (59) 39.16 2
Total 23404.7 100 15
2
2
2
R = 0.997, R = 0.994, R adjusted = 0.986, R for prediction = 0.881, Standard Error = 4.704,
Coefficient of variation = 15.836, Precision Index = 18.049
Table 3.5 Model coefficients estimated by multiples linear regression (significance of regression
coefficients), where X 1 =NaHCO 3 concentration (g/L), X 2 =Na 2HPO 4.12H 2O
concentration (mg/L) and X 3 = EFB ash concentration (g/L)
Factor Coefficient P value Std Error -95% 95% t Stat VIF
Intercept 246.32 3.99235E-07 10.53 220.57 272.08 23.40
X 1 -67.86 2.81281E-06* 4.032 -77.73 -57.99 -16.83 66.13
X 2 1.446 0.09882 0.741 -0.367 3.258 1.952 24.79
X 3 -0.158 0.775 0.527 -1.449 1.133 -0.299 27.58
2
X 1 4.504 8.96892E-06* 0.326 3.706 5.302 13.81 63.74
X 1X 2 -0.04795 0.502 0.06711 -0.212 0.116 -0.715 10.62
X 1X 3 0.03099 0.531 0.04664 -0.08315 0.145 0.664 12.29
2
X 2 -0.04966 0.142 0.02935 -0.121 0.02216 -1.692 17.03
X 2X 3 0.000962 0.947 0.01399 -0.03328 0.03520 0.06878 5.574
2
X 3 -0.00363 0.790 0.01304 -0.03555 0.02829 -0.278 15.47
*Significant level at 95%